Basis of Data

Sources of data and basis of calculations on mygolfdistance.com
Average Distances
- Average Distance results are compiled from data from the 2020 USGA Distance Insight Report with help from other studies including Arccos (2021) (& Shot Scope (2020) customer averages, Trackman and an age curve from Golf Analytics
- The methodology used was a simple best fit of all the data to be consistent with each of the sources
- Numbers are rounded to the nearest even number for ease of presentation and are based upon Driver only shots
- Distances represent total distance based on what the core data tracks.
Carry Distances
- For carry distance, the average male carry is 190 yards which is 88% of the total average distance of 216 yards with a similar 88% for ladies where the average carry is 147 yards versus average total distance of 167 yards
- According to Sure Shot US combined tour data, the average driver carry is 260 yards and total distance 287.3 yards, meaning carry = 90.5% of total distance
- PGA Tour data for 2020 has carry at 95% of total, and for the LPGA (slower ball speeds) the carry is 88%
- The ranges in our data are 83% to 93% with an overall average of 88%, the calculations based on Trackman and other actual statistics across the ball speed ranges
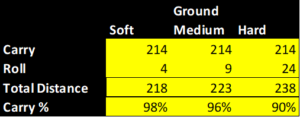
- The Flightscope optimizer gives average roll figures as follows for a 214 yard carry depending on ground conditions

So, as any golfer knows, in wintery soft conditions there is hardly any roll whereas in more ‘normal’ summer conditions roll can be as high as 20%+ . Ground conditions make the comparisons complicated, but with most publicised data originating from Tour type data played in good summer type conditions, our average of 88% is closer to the Flightscope ‘hard’ conditions. The resulting roll of 12% as such represents an average across the board for good summer conditions, but is certainly not the maximum that can be obtained
- As shown in the data, a golfer reaches his peak distance capability at around age 23 and deteriorates with age thereafter, which accelerates from about age 40. Distance is also almost directly correlated with handicap
- Shot Scope use a concept of Performance Average to remove very poor or mishit shots, to gain a truer view of the normal distance a player should expect with each club. The performance average for the driver is normally 7% higher than the average and this is used in our calculations of the average ‘good shot’
Optimal Distances
- The data on mygolfdistance.com has been derived from several sources including-
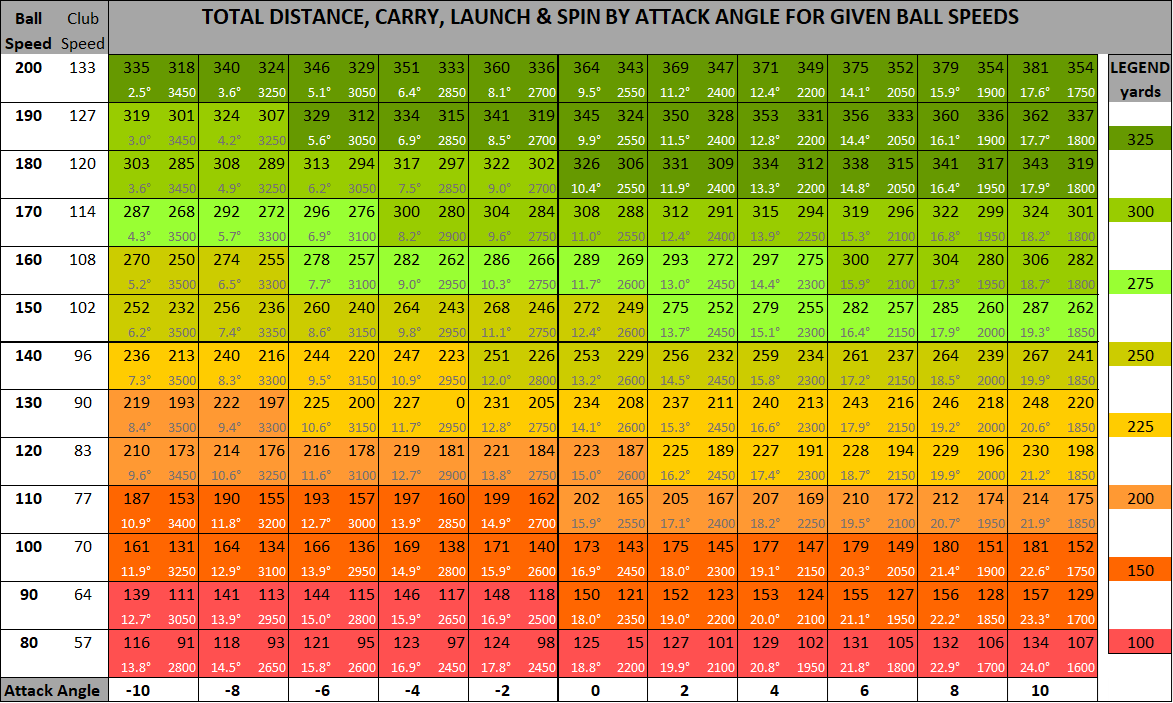
- The Ping proving grounds chart on optimal launch and spin for given ball speeds and angle of attacks repeated below
- Simulations of all ball speeds and optimal launch conditions on Flightscope and OptimalFlight software programmes
- Trackman and other actual launch and distance data for various swing speeds throughout the range under a variety of conditions including a variety of PGA Tour data as well as student data for slower ball speeds from other sources
- There are many factors that complicate calculations of optimal distances which give differences between the different simulators. Launch and spin are usually relatively easy to incorporate but angle of attack and roll are much more difficult. Actual Trackman data was mostly used as the guide to arbitrate such differences
- As with the Average Distance calculations, the method used for intermediary calculations and speeds was a simple best fit from the available sources with consistency check to all other sources to minimise differences.
- As a generalisation, the optimal carry figures were found to be most reliable from the OptimalFlight software linked above and the optimal total distances are a combination of all sources centred around the Ping Distance chart
